

Quantitative Research Question Examples Across 10 Disciplines
A strong quantitative research question does 4 things at once: it names a population, uses measurable variables, states a relationship or difference, and sets a context or time frame.
If I had to sum up the whole article in one line, it would be this: no matter the field, the pattern stays the same. The topic changes, but the question format does not. Across 10 disciplines - education, psychology, sociology, business, nursing, economics, political science, public health, marketing, and engineering - the best questions are built around numbers you can test.
Here’s the short version:
- Descriptive questions measure one thing in one group
- Comparative questions compare groups
- Correlational questions test links between variables
- Strong questions avoid yes/no wording
- Strong questions use one population, one predictor, one outcome, and one setting
For example, instead of asking, Do students who study more get better grades?, I’d ask: How does study time relate to GPA among first-year college students? That version is narrower and easier to test with data.
3 Types of Research Questions for Quantitative Research
sbb-itb-1831901
Quick Comparison
| Discipline | Main Focus | Sample Measurable Outcome |
|---|---|---|
| Education | Teaching tools and learning results | Test scores |
| Psychology | Behavior and mental performance | GPA, stress scores |
| Sociology | Group conditions and social outcomes | Income, mobility rates |
| Business | Firm decisions and results | Sales revenue |
| Nursing | Clinical factors and patient outcomes | Readmission rates |
| Economics | Policy or market shifts | Employment rates |
| Political Science | Voting and participation | Turnout, vote share |
| Public Health | Population exposure and outcomes | Hospitalization rates |
| Marketing | Ad inputs and business results | Sales, conversions |
| Engineering | Design inputs and system output | Efficiency, failure rate |
The main takeaway: if you can measure the input and the outcome, you can usually turn the topic into a workable quantitative question.
What follows is a field-by-field set of examples, plus a simple way to tighten your own draft fast.
What Makes a Strong Quantitative Research Question
A strong quantitative research question includes four parts: a specific population, a measurable variable, a clear relationship or group comparison, and a specific context. Leave out any one of those, and the question gets too broad to test in a meaningful way.
The examples below follow three core structures:
- Descriptive: Measures one variable in a population
- Comparative: Shows differences between groups
- Correlational: Looks at relationships between variables
These are the main question types used in the examples that follow.
| Question Type | What It Measures | Common Metrics |
|---|---|---|
| Descriptive | A single phenomenon within a population | Percentages, means, incidence rates |
| Comparative | Differences between two or more groups | GPA, wage gaps, test score averages |
| Correlational | Relationships between variables | Likert-scale scores, revenue figures, correlation coefficients |
Skip yes/no questions. They box you in too early.
Instead, ask about something you can measure, like social media use in minutes and adolescent self-esteem.
Use these patterns as a guide when reading the discipline examples that follow.
How to Read and Use the Examples Across Disciplines
Use the examples below as templates, not fixed wording. Each discipline section follows the same basic setup, even though the subject matter changes.
For example, nursing examples focus on patient outcomes and clinical interventions. Engineering examples, by contrast, focus on measurable physical properties like tensile strength or energy output. Different field, same core structure.
As you read, watch for a few recurring patterns:
- group differences
- intervention effects
- relationships between variables
- change over time
Once you spot that pattern, it gets much easier to move through each discipline section fast.
The easiest way to adapt an example is through variable substitution. In plain English: keep the relationship structure, then swap in the variables from your own field.
So if an example in one section compares one group to another, you can use that same setup in your own topic. Just replace the original variables with the ones that fit your study.
If your draft question is close but still too vague, use Yomu AI to tighten the population, variables, and study focus.
1. Education
In education, this pattern usually connects one teaching tool to one student result you can measure. Studies in this area often look at things like test scores, attendance rates, and time-on-task.
Example question: How does the use of reading apps affect reading comprehension scores among elementary school students?
This works because the question is clear and narrow. It points to a specific tool, a defined student group, and a result you can track with numbers.
If you want to use this model, include:
- the tool
- the student group
- the score or result you plan to measure
Use a clear tool and a numeric outcome, such as a reading app and comprehension scores.
2. Psychology
Psychology uses the same quantitative setup, but the focus moves from instruction to behavior and mental performance. Here, a strong quantitative question connects one measurable behavior or condition to one measurable outcome.
Example question: How does daily social media use relate to GPA among college students?
Because both variables are numeric, the question can be tested with statistics.
The key is to define both variables in numeric terms. You can use measures like stress scores, sleep duration, anxiety scales, memory recall, or GPA. And instead of broad labels like "well-being" or "mental health", use a specific scale so the question stays clear and testable.
3. Sociology
Sociology looks at how institutions, inequality, and group membership shape outcomes you can measure. That makes it a strong fit for questions about group differences and social change. The key difference here is simple: sociology shifts the focus from individuals to institutions.
To make the question testable, turn broad social ideas into things you can measure. In plain English, that means using proxies. So instead of abstract terms like social capital, class, or deviance, use survey scores, income brackets, or arrest rates. For instance, you could ask how low social capital in urban housing projects affects upward mobility for second-generation immigrants.
Example question: How does low social capital in urban housing projects affect upward mobility for second-generation immigrants?
This works because it clearly names the condition, the group, and the outcome.
Large datasets are often the best choice when you want to compare groups or follow trends over time. Use micro-level questions when you're looking at individual behavior. Use macro-level questions when the focus is institutions or broader trends.
A good way to frame the question is around a one-unit change in one variable and the measured change in another. Think of an additional year of education and the change that follows in income or mobility. Keep the setup simple: social condition, defined population, measurable outcome. Then swap in your own condition, group, and outcome to fit your topic.
4. Business and Management
Business and management shifts the focus from social structures to decisions inside organizations. These questions usually test whether one measurable choice links to one measurable result, like training spend and sales revenue. The strongest version keeps things simple: one measurable input and one measurable outcome.
Example question: To what extent does annual training spend per salesperson predict quarterly sales revenue in mid-sized retail firms in the United States?
Here, training spend is the input. Sales revenue is the outcome. Mid-sized U.S. retail firms define the population. That makes the question testable because both variables are numeric and tied to a clear type of firm.
You can swap in other business variables, such as incentive pay or employee engagement, and pair them with outcomes like turnover or customer satisfaction. The same basic pattern works across business topics: one decision, one outcome, and one defined firm group.
5. Nursing
Nursing research usually links one clinical factor to one patient outcome you can measure.
Example question: Does a lower nurse-to-patient staffing ratio predict lower 30-day hospital readmission rates?
In this case, the nurse-to-patient ratio is the independent variable, and the 30-day readmission rate is the dependent variable.
You can use that same setup for other nursing topics too. The key is to choose exact metrics. That might mean medication adherence measured as the percentage of prescribed doses taken, pain scores on a 1–10 scale, patient-fall frequency, hospital-acquired infection rates, or patient satisfaction scores.
6. Economics
Economics questions usually test how one policy or market shift affects one measurable outcome. Research in this area often looks at variables such as wages, prices, employment levels, and government policy interventions.
Example question: How does minimum wage level relate to employment rates among low-wage workers in U.S. states that increased their minimum wage from 2010 to 2024?
In this example, minimum wage is the policy variable, and employment rate is the outcome. Both can be measured through government data, surveys, or wage records, so the question is clear and testable.
The same basic setup works for topics like inflation, taxes, interest rates, or consumer spending. The key is to keep the question tight: one policy, one outcome, and one time frame. For example: What is the relationship between inflation rate and household spending among U.S. consumers over a 12-month period? Keep the focus on one policy change, one economic indicator, and one outcome.
7. Political Science
Quantitative Research Question Examples in Voting Behavior and Political Participation
Political science uses the same measurable question structure as the previous fields, but the outcomes here deal with elections and public institutions. It becomes quantitative when you measure things like participation, trust, or party support with clear numeric indicators such as turnout rates, vote shares, dollar amounts, index scores, or survey scales.
Example question: How does household income level affect voter turnout in U.S. congressional elections?
In this case, household income is measured in income brackets, and voter turnout is the share of eligible voters who cast a ballot. Researchers often study questions like this with election returns and survey data such as the American National Election Studies (ANES).
The same setup works for related topics. For example: What is the relationship between local campaign spending per registered voter and third-party vote share in U.S. municipal elections? Spending is measured in USD per registered voter, and the outcome is third-party vote share as a percentage.
The pattern stays the same across election studies: one measurable predictor, one measurable outcome, and one clearly defined political setting. You might focus on turnout, vote share, approval, or donations, then tie the question to a single election, district, or level of government.
8. Public Health
Quantitative Research Question Examples in Disease Prevention and Health Outcomes
Public health shifts the focus from individual care to prevention and surveillance across whole populations. The goal is to study how programs, exposures, and policies affect outcomes at scale.
Example question: What is the relationship between vaccination rates and influenza-related hospitalization rates among older adults?
This kind of question works well in public health because rate-based outcomes often fit the field best. That includes measures like incidence, coverage, and hospitalization. In this example, both variables are numeric and testable, so vaccination rates act as the independent variable, while hospitalization rates act as the dependent variable.
PICO(T) - Population, Intervention, Comparison, Outcome, Timeframe - helps define the study and keep the question specific.
That same setup also fits screening, prevention, and health education research. Keep it tight: one exposure, one outcome, one population, and one time frame.
9. Marketing
Quantitative Research Question Examples in Consumer Behavior and Advertising
Marketing shifts the focus from health outcomes to consumer behavior. That means the numbers change too. Instead of tracking recovery rates or symptoms, you’re usually looking at metrics like clicks, conversions, sales, ad spend, or revenue.
Marketing research questions tend to work best when they tie one clear input to one measurable business result. That simple setup makes the question easier to test and easier to analyze.
Example question: To what extent does a 10% increase in digital advertising spend affect monthly sales revenue among e-commerce retailers in the United States?
This question is testable because it connects one specific marketing change with one measurable outcome.
A useful stem is: How does [marketing input] affect [measurable outcome] in [population]?
That same measurable-input, measurable-output pattern also shows up in engineering.
10. Engineering
Quantitative Research Question Examples in Design Variables and Measurable Outcomes
Engineering follows the same pattern as other fields: a measurable input leads to a measurable output. The difference is that the variables are often physical or tied to a system. In practice, engineering questions look at how a controllable design choice affects a measurable performance result. In some cases, the work also follows a design-and-test model, where you build a solution first and then test how well it performs.
A strong engineering question points to one clear design variable - like a material, a structural part, or an algorithm setting - and then tracks its effect on a numeric result such as efficiency, strength, or speed.
How does the thickness of a thermal coating affect the heat dissipation rate of a microchip?
Stick with variables you can control and outcomes you can measure with numbers. Common outcomes include:
- Efficiency
- Strength
- Failure rate
- Production time
- MTBF
Cross-Disciplinary Patterns for Refining Better Questions
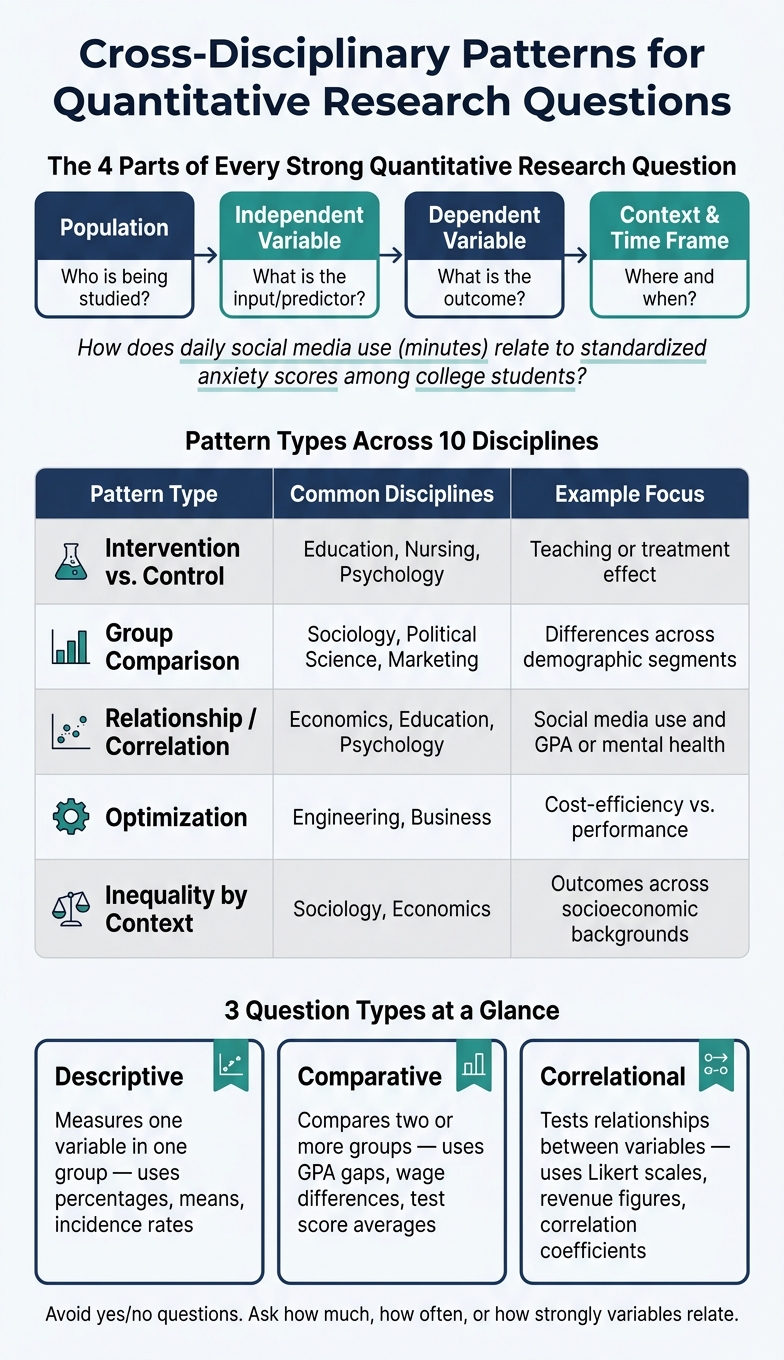
Quantitative Research Question Types by Discipline
Use the examples above to sort your draft question into a pattern.
Here’s the useful part: across 10 disciplines, the same question shapes show up again and again. The labels change. The variables change. But the structure stays pretty much the same.
Intervention-versus-control comparisons appear in education, psychology, and nursing. Group comparisons show up in sociology, political science, and marketing. Once you spot the pattern, you can plug in your own population, variable, and outcome.
Each question should be built from four parts: population, independent variable, dependent variable, and context and time frame. For example: "How does daily social media use in minutes relate to standardized anxiety scores among college students?" That works because each part is specific and measurable.
The table below shows the most common structural patterns and the disciplines where they appear most often:
| Pattern Type | Common Disciplines | Example Focus |
|---|---|---|
| Intervention vs. Control | Education, Nursing, Psychology | Teaching or treatment effect |
| Group Comparison | Sociology, Political Science, Marketing | Differences across demographic segments |
| Relationship/Correlation | Economics, Education, Psychology | Social media use and GPA or mental health |
| Optimization | Engineering, Business | Cost-efficiency vs. performance |
| Inequality by context | Sociology, Economics | Outcomes across socioeconomic backgrounds |
After you match the pattern, tighten the topic. Name one population, one variable, and one outcome. That’s how you avoid the “everything” question: a big topic, too many causes, and no clear way to test it.
Also, skip yes/no wording. "Do students who study more get better grades?" sounds simple, but it doesn’t give you much to work with. "How does study time relate to academic performance among first-year students?" is stronger because you can measure it. Aim for questions that ask how much, how often, or how strongly variables are related.
Using Digital Tools to Develop Quantitative Questions Responsibly
After you match your topic to a question pattern, use digital tools to tighten the wording and double-check the sources. These tools can help with three parts of the process: brainstorming, source review, and citation checks.
A good starting point is brainstorming variables. AI-based tools can help you map the four parts of a strong quantitative question: population, independent variable, dependent variable, and context. One simple prompt format is: "How does [Variable A] affect [Variable B] among [Population]?"
Once that structure is in place, turn to sources to see whether your question fills a real gap. Literature summaries can point you to places where the evidence is thin, and that's often where a strong quantitative question starts.
Use Yomu AI for drafting, paraphrasing, summarization, and citation formatting, but keep your own judgment at the center. The ethical rule here is simple: use AI to improve your wording, not to do your thinking for you.
The last step is citation support and plagiarism checking. Citation tools can help connect your question to credible, peer-reviewed studies. A plagiarism checker can confirm that your final wording is original. Together, these tools help you test whether the question stays specific, measurable, and backed by sources.
Conclusion
Across all 10 disciplines in this guide, the pattern stays the same even when the topic shifts. Each example fits its field and remains measurable, with a clear population, specific variables, and a stated relationship that can be checked with data. Strong research questions are specific, measurable, and tied to the study context.
Treat these examples like templates. Plug in your topic, variables, and setting, then tighten the wording until the question is narrow enough to test with data. If you can measure it, compare it, or test it, your question is ready for research.
FAQs
How do I turn a broad topic into a quantitative question?
Start by narrowing the topic to a clear scope. You can do that by focusing on a specific population, location, time period, or set of variables. Then zero in on one problem or relationship you want to study.
Next, define your independent and dependent variables. After that, decide whether your question is descriptive, comparative, or relational. The goal is simple: make the question specific, measurable, and realistic based on your time, resources, and access to data.
What makes a research question measurable?
A research question is measurable when it focuses on specific numerical data instead of vague or abstract ideas. In plain English, you should be able to count it, compare it, or track it. To get there, clearly define your independent variable, dependent variable, and target population.
It also needs to be testable. That means you have the time, tools, resources, and data access to answer it in a practical way. Clear wording matters here. It points your data collection in the right direction and makes statistical analysis more accurate.
How do I choose the right question type for my study?
Start with your study’s main aim.
Use a descriptive question when you want to measure traits or spot trends in one group. Use a comparative question when you want to look at differences between groups or conditions. Use a relational question when you want to examine links between variables.
Your question should be specific, doable, and tied closely to your research goals. For clinical or intervention-focused studies, the PICOT framework can help: Population, Intervention, Comparison, Outcome, and Timeframe.