
Common Research Methodology Mistakes and How to Fix Them
Flawed research methods can ruin your study. Whether it's unclear research questions, poor sampling, or data analysis errors, these issues can lead to biased results, wasted time, and even rejection from journals or supervisors. But the good news? These problems are avoidable.
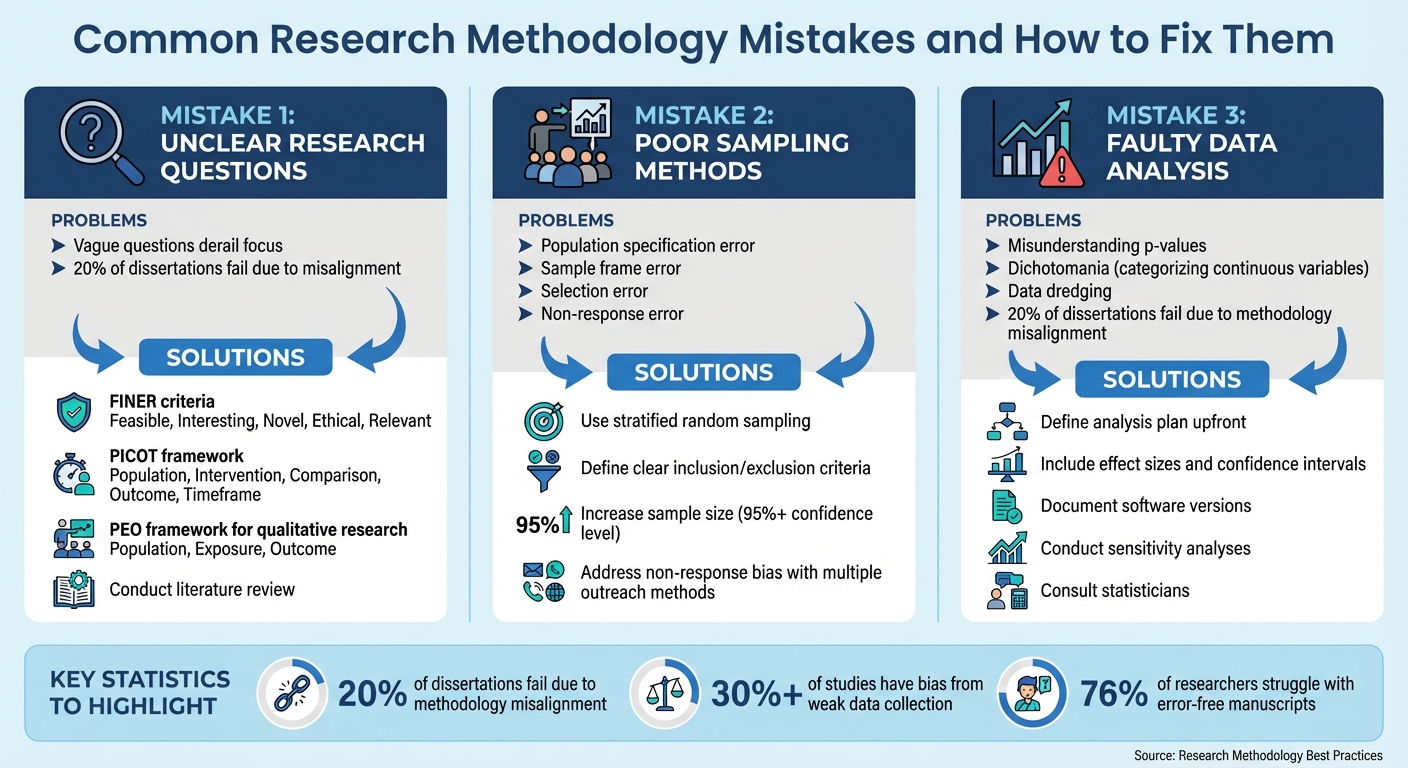
Here are the top three mistakes researchers make - and how to fix them:
- Unclear Research Questions: Vague or overly broad questions derail focus and misalign your study. Use frameworks like FINER, PICOT, or PEO to refine your question.
- Poor Sampling Methods: Errors like bias, non-response, or outdated sampling frames distort results. Solutions include stratified random sampling, clear criteria, and improving participation rates.
- Faulty Data Analysis: Misinterpreting p-values, cherry-picking data, or using the wrong statistical methods leads to unreliable conclusions. Define your analysis plan upfront, include effect sizes, and consult experts when needed.
Key takeaway: Thoughtful preparation and clear methodology can save your research from these common pitfalls. Always document your process, seek feedback, and use tools like Yomu AI for clarity and consistency.
Top 3 Research Methodology Mistakes and Solutions
How To NOT Wreck Your Research Methodology 🎓
sbb-itb-1831901
Mistake 1: Unclear Research Questions
A strong research question is the backbone of any study, guiding your methodology and data collection process. When questions are too vague or overly broad, the study can lose direction. As ATLAS.ti explains, a focused research question helps narrow a broad topic into a precise area of study.
Problems with Research Questions
Vagueness in research questions can lead to major issues. For instance, a question like "How does social media affect people's behavior?" lacks clarity about which platform, behaviors, or population the study will focus on. Broad questions like this make it hard to maintain focus and can overwhelm researchers with too many variables. On the other hand, leading or assumptive questions can introduce bias, skewing your findings.
Interestingly, research shows that 20% of unsuccessful dissertations fail due to misalignment between methodology and research aims. Poorly defined questions directly impact key aspects of your study, such as the methodology, sample size, data collection tools, and analysis techniques.
How to Improve Research Questions
Improving your research question involves a systematic approach to ensure clarity and focus.
- Use the FINER criteria: Feasible, Interesting, Novel, Ethical, and Relevant.
- For quantitative or clinical studies, apply the PICOT framework: Population, Intervention, Comparison, Outcome, and Timeframe.
- For qualitative research, consider the PEO framework: Population, Exposure, and Outcome.
A literature review is another essential step. It helps you identify gaps in existing research and refine your question. For example, instead of asking, "How does social media affect behavior?" you could ask, "What effect does the daily use of YouTube have on the attention span of children under 16?" This revised question specifies the platform, behavior, and target population, making it much clearer.
Don’t hesitate to seek feedback from peers or mentors. They can provide valuable insights, challenge your assumptions, and help pinpoint areas that need more precision. Tools like Yomu AI can also assist in refining your wording, ensuring your question is clear and professional.
Mistake 2: Poor Sampling Methods
Sampling methods play a critical role in shaping the reliability of research findings. When researchers use flawed sampling techniques, they risk introducing bias that distorts results and undermines the broader applicability of their study. To address this, it’s essential to understand two key concepts: sampling error and sampling bias. Sampling error refers to the natural variation that occurs when studying a sample rather than the entire population. On the other hand, sampling bias is a systematic issue that arises when certain groups are consistently over- or underrepresented, leading to skewed and unreliable conclusions. Below, we explore some common sampling mistakes that can jeopardize the validity of a study.
Common Sampling Errors
One frequent issue is population specification error, which occurs when the target population is not clearly defined. For instance, if a study aims to survey "young adults" but fails to specify an age range, the term can be interpreted differently, leading to inconsistent data. Another problem, sample frame error, arises when the list used to select participants is incomplete or outdated - like relying on a phone directory that excludes people who only use cell phones.
Selection error is another pitfall, often seen in convenience sampling, where participants either self-select into the study or are chosen based on ease of access. This can lead to a sample that doesn’t represent the broader population. Lastly, non-response error occurs when individuals who do not participate in the study differ significantly from those who do, potentially skewing the results.
A classic example of sampling gone wrong is the 1936 U.S. Presidential Election prediction by The Literary Digest. The magazine polled over 2.4 million people using phone directories and car registration lists to forecast the winner between Franklin D. Roosevelt and Alf Landon. However, during the Great Depression, phones and cars were luxury items, meaning the sample disproportionately included wealthier Republicans. The magazine predicted Landon would win with 57% of the vote, but Roosevelt won in a landslide with 62%. This 19% error not only discredited the poll but also contributed to the magazine’s downfall.
Improving sampling methods is crucial for enhancing research credibility and ensuring results that stand up to scrutiny.
How to Fix Sampling Problems
To address these common errors and refine your sampling approach, consider the following strategies:
- Stratified Random Sampling: Divide your population into subgroups (e.g., by age, income, or education) and randomly sample within each group. This method ensures proportional representation and allows for meaningful comparisons across subgroups.
- Clearly Define Inclusion and Exclusion Criteria: Before starting your study, establish measurable criteria for who qualifies to participate. For example, specify exact age ranges or geographic boundaries to avoid ambiguous definitions and improve transparency.
- Increase Sample Size: While a larger sample size reduces sampling error, keep in mind there are diminishing returns. Doubling your sample size typically reduces error by only about 29%. Aim for a confidence level of 95% or higher to ensure robust findings.
- Address Non-Response Bias: Use multiple outreach methods - like email, phone calls, social media, and in-person visits - to engage potential participants. Following up with non-responders and offering incentives can also help boost participation rates.
- Document Sampling Choices: Clearly explain why you selected a particular sampling method, how it aligns with your research goals, and any limitations it introduces. Transparency strengthens your study’s credibility and helps others evaluate its validity.
Here’s a quick comparison of different sampling methods and their associated risks:
| Sampling Method | Ideal For | Bias Risk |
|---|---|---|
| Simple Random | Large, well-defined populations | Low (if the frame is complete) |
| Stratified Random | Diverse populations with key subgroups | Very Low (ensures representation) |
| Convenience | Quick, low-cost exploratory research | High (unrepresentative) |
| Cluster | Geographically widespread populations | Moderate (potential intra-cluster similarity) |
Mistake 3: Faulty Data Analysis
Faulty data analysis can derail even the most well-designed study. Just like crafting strong research questions and selecting appropriate sampling methods, accurate data analysis is fundamental to producing reliable and credible results. Poor analytical decisions can lead to misleading conclusions, wasted resources, or a damaged reputation. Knowing where analysis commonly goes wrong - and how to avoid those pitfalls - can make all the difference.
Common Data Analysis Errors
One of the most frequent issues is misunderstanding statistical significance. Researchers often focus too heavily on p-values without considering effect sizes, or they dismiss findings as irrelevant when p-values exceed 0.05. As Dr. Grace Alexander puts it:
Statistical significance doesn't equal practical or clinical significance. Effects that aren't statistically significant don't provide strong evidence that the effect doesn't exist.
This narrow perspective can lead to either ignoring valuable patterns or exaggerating trivial ones.
Another common mistake is dichotomania, which involves turning continuous variables into arbitrary categories. While this might seem like it simplifies the analysis, it actually increases the chances of both false positives (Type I errors) and false negatives (Type II errors). This approach also removes critical nuances that could impact your conclusions. Similarly, relying solely on listwise deletion to handle missing data can introduce bias and weaken statistical power, especially if the data isn't missing completely at random.
Misaligned methodologies are another major issue. When the chosen methods don’t align with the research questions or data types, the study loses coherence. In fact, methodology misalignment contributes to the failure of 20% of dissertations. For instance, applying regression analysis to infer causation in an observational study without acknowledging its limitations could lead to overstated claims. Another trap is data dredging - searching for patterns in the data and reporting only the significant ones - which significantly increases the risk of false findings.
Avoiding these common errors is vital to maintaining the integrity of your research.
How to Improve Data Analysis
Start by clearly defining your research goal - whether it’s to predict, explain, or describe - and select a statistical model that aligns with that aim. For meta-analyses, a random effects model is almost always a safer choice than a fixed effects model, as it better accounts for variations across different study populations. Avoid automated stepwise regression; instead, rely on expert judgment or modern techniques like LASSO for variable selection.
Prespecify your analysis plan before diving into the data to avoid cherry-picking results. Clearly outline your statistical procedures, significance thresholds, and approach to handling missing data in advance. Always include effect sizes and confidence intervals alongside p-values to provide a fuller picture of your findings' precision and relevance. Dr. Grace Alexander emphasizes:
If someone wanted to replicate your study, could they do so from your description alone? If not, you haven't provided sufficient detail.
This means documenting specifics like the exact version of your statistical software (e.g., "R V.3.12") and citing any additional packages used.
To minimize errors, validate your results through peer reviews or consult with a statistician. Conduct sensitivity analyses to test how robust your findings are under varying assumptions - particularly when dealing with missing data or uncertain parameters. Using multiple data sources and methods, a process known as triangulation, can also strengthen the validity of your conclusions. Lastly, be upfront about your study's limitations. Discuss any constraints in your methodology, explain their potential impact on your results, and address them transparently rather than glossing over them.
Here’s a quick summary of common errors and how to address them:
| Error Type | Consequence | Mitigation Strategy |
|---|---|---|
| Type I Error (False Positive) | Implementing ineffective treatments or wasting resources | Set a lower significance level (e.g., 0.01) |
| Type II Error (False Negative) | Missing real effects or lost innovation opportunities | Increase sample size and ensure adequate statistical power (target 80% or higher) |
Other Ways to Improve Your Research Methodology
General Best Practices
Strengthening your research methodology goes beyond quick fixes - it requires careful planning and attention to detail. A solid methodology starts with precise language. This ensures your work is clear and reproducible, leaving no room for ambiguity. Every step you take should be documented with clarity to build a reliable foundation.
Another key step is to align your methodology with your theoretical framework. This alignment should guide your decisions and provide a clear rationale for your choices. When your methodology is rooted in a strong theoretical base, it becomes easier to justify your approach and maintain consistency throughout your research.
Thorough planning is essential. Conduct a formal power analysis to determine an appropriate sample size, and prespecify your statistical analysis plan to avoid falling into the trap of data dredging. These proactive steps help you anticipate and address potential issues before they arise.
Platforms like Yomu AI can be incredibly helpful in maintaining focus and coherence. By ensuring your methodology aligns with your research objectives and theoretical framework, tools like these can help you avoid common pitfalls. This is particularly important considering that methodology misalignment contributes to 20% of unsuccessful dissertations.
Adhering to established reporting guidelines, such as those from the EQUATOR Network, ensures you include all the critical elements in your methodology. Also, conducting pilot tests of your data collection tools allows you to identify and fix any confusing questions or procedural issues before you fully roll out your study. These steps enhance both the reliability and transparency of your research.
Quick Reference: Errors and Solutions
| Common Methodological Error | Recommended Solution |
|---|---|
| Unclear Research Design | Clearly define the study as qualitative, quantitative, or mixed-methods, and justify your choice |
| Vague Descriptions | Specify equipment models, software versions, and provide step-by-step details |
| Sampling Bias | Use stratified or random sampling and clearly define inclusion and exclusion criteria |
| Data Dredging | Prespecify your analysis plan to avoid fishing for results |
| Table 2 Fallacy | Avoid interpreting regression coefficients of confounding variables as causal relationships |
| Ignoring Ethics | Obtain and document IRB or ethics committee approval |
| Dichotomania | Analyze continuous or ordinal data on their original scale rather than dichotomizing them |
Conclusion
Steering clear of typical research methodology mistakes takes more than simply sticking to a set of rules - it requires grasping the reasoning behind each decision you make. Tackling problems like vague research questions, flawed sampling techniques, and errors in data analysis lays the groundwork for research that is both valid and dependable. The obstacles, however, are real: methodological misalignment accounts for 20% of failed dissertations, weak data collection practices lead to bias in over 30% of studies, and a staggering 76% of researchers face difficulties creating error-free manuscripts.
The good news? Most of these pitfalls can be avoided with thoughtful preparation and a structured approach.
"Avoiding common methodological errors isn't just about following rules; it's about understanding the 'why' behind research design decisions." – Dr. Grace Alexander
In light of these challenges, using the right tools becomes critical. Yomu AI offers support in maintaining clarity and consistency throughout your methodology, helping ensure your research remains rigorous and reproducible. Whether it’s documenting technical details or keeping your manuscript aligned, the right tools can make a noticeable impact.
FAQs
How do I choose between FINER, PICOT, and PEO?
When deciding between FINER, PICOT, and PEO, the choice depends on the nature of your study and its goals:
- PICOT works best for clinical or intervention-focused research. It breaks your study into five key elements: Population, Intervention, Comparison, Outcome, and Time. This structure is particularly helpful for designing studies that test specific treatments or interventions.
- PEO is tailored for qualitative research. It focuses on Population, Exposure, and Outcome, making it ideal for exploring experiences, perceptions, or the effects of certain exposures.
- FINER helps assess the quality of your research question. It evaluates whether the question is Feasible, Interesting, Novel, Ethical, and Relevant. This framework ensures your study is well-designed and meaningful.
Choose the framework that best matches your research type and objectives to guide your study effectively.
How can I reduce non-response bias in my sample?
To cut down on non-response bias, it's essential to work on improving participation and response rates. Start with clear, concise, and engaging survey questions - this helps avoid overwhelming participants and keeps them interested. Personalizing your invitations can make respondents feel valued, while offering incentives provides an extra nudge to take part. Don't forget to send follow-up reminders to gently encourage those who haven't responded yet.
Another key step is making sure your survey is accessible and works seamlessly across different devices. This ensures more people can participate without technical barriers. By taking these measures, you can bridge the gap between respondents and non-respondents, leading to a sample that's more reflective of your target group.
What should a prespecified analysis plan include?
A prespecified analysis plan serves as a detailed guide for how data will be analyzed, ensuring that the process aligns with the study's goals and theoretical framework. It should clearly define the analytical methods, specify criteria for which data will be included or excluded, and outline steps to address potential biases or confounding variables. Essentially, this plan acts as a roadmap, helping researchers stay focused and maintain methodological consistency throughout the study.